Running a node

Monitoring your node

NIS listens on port 7890, so a first way to monitor your node is to check that your server listens on that port. As an example we will configure UptimeRobot to monitor that port. This should give you the required information to configure any other monitoring solution.

It is possible to get information from a running nis by sending HTTP requests. Several URLS are handled.

Status URLs will give JSON-formatted answers, and their meaning is detaild in the NIS API documentation.

Node URLs will give information on the node, such as the version that it is running.

Status URL /heartbeat

You configure your monitoring solution to send requests to the url http://YOUR_IP:7890/heartbeat. A NIS instance receiving this request will answer if the node is up and able to answer to requests.

In UptimRobot, the form configuring a new monitor hence looks like this:

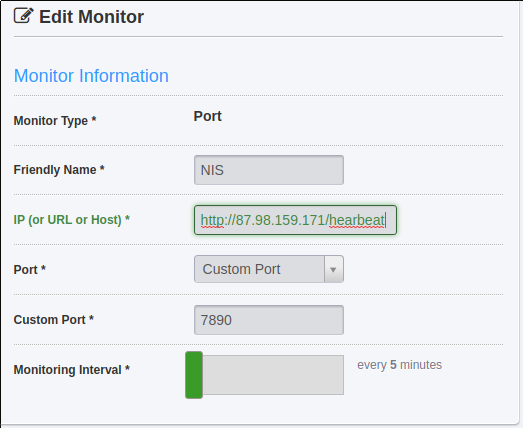
UptimeRobot Monitor definition

Status URL /status

The URL /status of your node returns a small JSON object giving some info on your node’s status. Check the NIS API documentation linked above for its meaning.

Status URL /node/info

A request sent to that URL gets a JSON-formatted response, giving basic information on the node, such as its version and the network it is running on (mainnet, testnet)

$ http http://104.238.161.61:7890/node/info
GET /node/info HTTP/1.1 Accept: */* Accept-Encoding: gzip, deflate Connection: keep-alive Host: 104.238.161.61:7890 User-Agent: HTTPie/0.9.8 HTTP/1.1 200 OK Access-Control-Allow-Headers: Content-Type Access-Control-Allow-Origin: * Content-Encoding: gzip Content-Type: application/json Server: Jetty(9.2.11.v20150529) Transfer-Encoding: chunked Vary: Accept-Encoding, User-Agent { "endpoint": { "host": "104.238.161.61", "port": 7890, "protocol": "http" }, "identity": { "name": "Hi, I am Alice7", "public-key": "64f0c867c52e8d3f7fe478854dbb197646d06041cc16b56595c03a217af6564b" }, "metaData": { "application": null, "features": 1, "networkId": 104, "platform": "Oracle Corporation (1.8.0_31) on Linux", "version": "0.6.87-BETA" } }

Status URL /node/extended-info

The extended-info URL gives a bit more information. Check for yourself if this is interesting to you:

$ http http://104.238.161.61:7890/node/extended-info
GET /node/extended-info HTTP/1.1 Accept: */* Accept-Encoding: gzip, deflate Connection: keep-alive Host: 104.238.161.61:7890 User-Agent: HTTPie/0.9.8 HTTP/1.1 200 OK Access-Control-Allow-Headers: Content-Type Access-Control-Allow-Origin: * Content-Encoding: gzip Content-Type: application/json Server: Jetty(9.2.11.v20150529) Transfer-Encoding: chunked Vary: Accept-Encoding, User-Agent { "nisInfo": { "application": "NEM Deploy", "currentTime": 67458115, "signer": null, "startTime": 65130847, "version": "0.6.87-BETA" }, "node": { "endpoint": { "host": "104.238.161.61", "port": 7890, "protocol": "http" }, "identity": { "name": "Hi, I am Alice7", "public-key": "64f0c867c52e8d3f7fe478854dbb197646d06041cc16b56595c03a217af6564b" }, "metaData": { "application": null, "features": 1, "networkId": 104, "platform": "Oracle Corporation (1.8.0_31) on Linux", "version": "0.6.87-BETA" } } }

Keeping an eye on the logs under linux

If you want to be sure your node stays functional, it is important to monitor logs produced by NIS. One of the easiest ways to be alerted by mail when an unexpected log message is produced is to use [logcheck](https://linux.die.net/man/8/logcheck]. This is a tool that is run from cron. It will look at logged messages since its last run, and notify you of messages that it was not configured to ignore. As it is working with an ignore list, you can enhance the ignore list everytime you get messages you want to ignore. A good starting point for the nem ignore list is provided though.

The first step is of course to install logcheck. Under debian based distribution this is done with

apt-get install logcheck

and under Redhat based distribution:

yum install logcheck

You then edit /etc/logcheck/logcheck.conf and set the email address to send the reports to:

# Controls the address mail goes to:
# *NOTE* the script does not set a default value for this variable!
# Should be set to an offsite "emailaddress@some.domain.tld"

SENDMAILTO="myemail@example.com"

Then add the nis logfile to analyse in /etc/logcheck/logcheck.logfiles:

# these files will be checked by logcheck
/var/log/syslog
/var/log/auth.log
/home/nem/nis/logs/nis-0.log

With this configuration, logcheck will send you all the files from the nis logs, as we haven’t configured any ignore list. An ignore list is simply a file with one regular expression per line. Lines matching any of these regular expressions will be ignored by logcheck. Any line not matching these regular expressions will be reported by logcheck. The package of your distribution includes ignore files, but those don’t cover NIS messages, so we will have to add an additional ignore list.

If you kept the default reporting level of server, you will have to place the additional ignore file under /etc/logcheck/ignore.d.server.

curl https://github.com/rb2nem/nem-dev-guide/blob/master/docker/docker-compose.yml > /etc/logcheck/ignore.d.server/nem

A cron entry should have been added by the package installed (look for /etc/cron.d/logcheck, /etc/cron.hourly/logcheck ot an entry in /etc/crontab). By default logcheck is run hourly.

With this setup, you can still miss some messages as NIS rotates its logs itself. If you want to not miss any log line, add this code in the file `/usr/share/logtail/detectrotate/99-nis.dtr:

#!/usr/bin/perl

sub {
  my ($filename) = @_;
  my $rotated_filename="";
  $filename =~ /(.*)nis-([0-9]+).log/;
  my $path=$1
  my $old_number = $2+1;
  if (-e "nis-$old_number.log" && (mtime("$filename.0") > mtime("$filename.1.gz")) ) {
    # assume the log is rotated by savelog(8)
    # syslog-ng leaves old files here
    $rotated_filename="${path}nis-$old_number.log";
  }
  return $rotated_filename;
}