Debugging
Debugging REST API requests
With the devguide containers
The docker environment accompanying this guide provides mitmweb to inspect requests sent to the NIS instance running in the container. This section will show how to use it.
We will send requests to out NIS in the ruby language, using the rest-client gem.
We will try to get the block at the current height, which, as we have already seen, is obtained by sending a POST request to /block/public/at with
a JSON payload telling the height of the block we want to retrieve.
According to the documentation of rest-client this is done easily. We will do it in the interactive ruby interpreter that can be
started with the command irb in the tools container. Once in the interpreter, we type
require 'rest-client'
RestClient.post 'http://localhost:7890/block/at/public', {'height': '243'}
This however returns an error message:
RestClient::InternalServerError: 500 Internal Server Error
	from /var/lib/gems/2.3.0/gems/rest-client-2.0.2/lib/restclient/abstract_response.rb:223:in `exception_with_response'
	from /var/lib/gems/2.3.0/gems/rest-client-2.0.2/lib/restclient/abstract_response.rb:103:in `return!'
	from /var/lib/gems/2.3.0/gems/rest-client-2.0.2/lib/restclient/request.rb:809:in `process_result'
	from /var/lib/gems/2.3.0/gems/rest-client-2.0.2/lib/restclient/request.rb:725:in `block in transmit'
	from /usr/lib/ruby/2.3.0/net/http.rb:853:in `start'
	from /var/lib/gems/2.3.0/gems/rest-client-2.0.2/lib/restclient/request.rb:715:in `transmit'
	from /var/lib/gems/2.3.0/gems/rest-client-2.0.2/lib/restclient/request.rb:145:in `execute'
	from /var/lib/gems/2.3.0/gems/rest-client-2.0.2/lib/restclient/request.rb:52:in `execute'
	from /var/lib/gems/2.3.0/gems/rest-client-2.0.2/lib/restclient.rb:71:in `post'
	from (irb):2
	from /usr/bin/irb:11:in `<main>'
This error message is not very helpful, so we might want to take a look at the mitmweb page available at http://localhost:8081
after you start containers with the script ndev as explained ealier.
Opening Mitmweb in your browser (use Firefox if you get a blank page in Google Chrome), and selecting the last request in the list,
you should see a page similar to this:
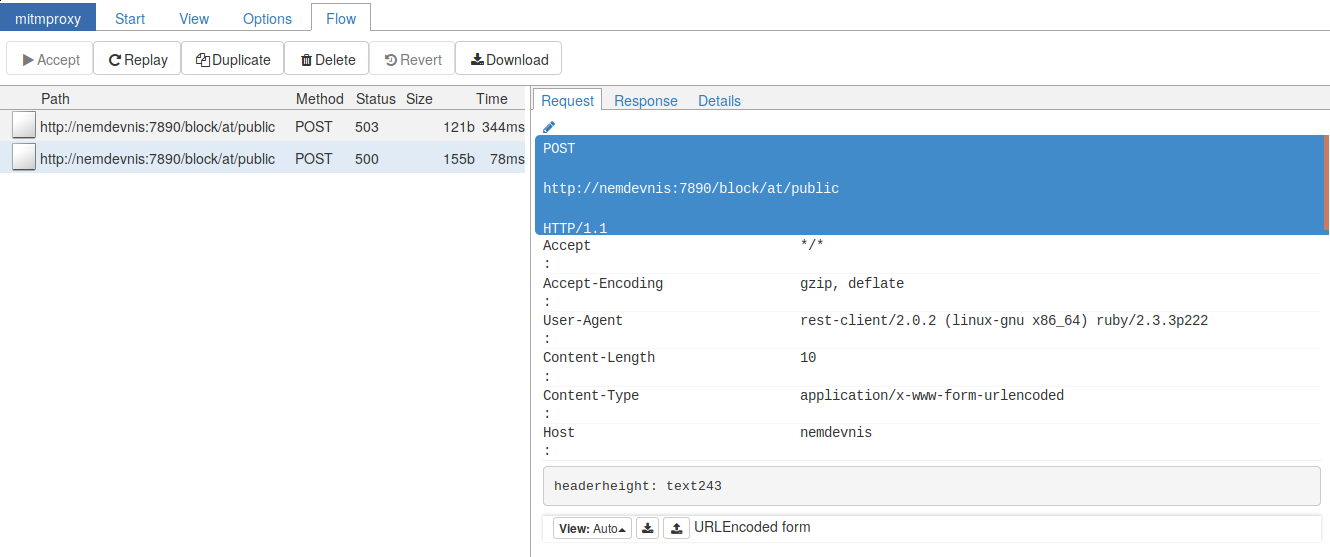
Mitmweb Overview
The left pane lists the requests it has been intercepted (2 in this case), and
the right pane gives you a detailed view of the request and response headers.
The User-Agent header shows this request has been sent by rest-client to the
host nemdevnis (the container running our NIS instance) with a content type
header application/x-www-form-urlencoded.
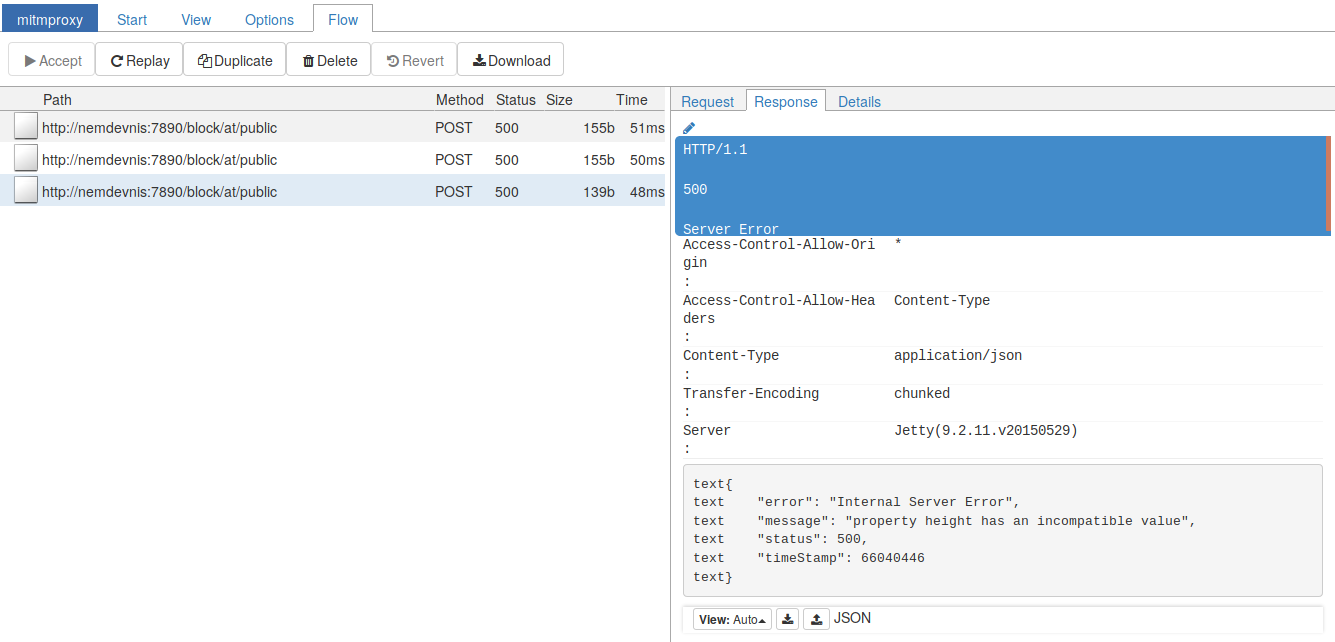
Clicking on the Response link of the right tab shows this:

Response Headers
We can fix this by setting the content type header to json and ensure we send a json payload:
require 'rest-client'
require 'json'
RestClient.post 'http://localhost:7890/block/at/public', {'height': '243'}.to_json, {content_type: :json, accept: :json}
This still yields an error in ruby, which is not much clearer:
RestClient::InternalServerError: 500 Internal Server Error
	from /var/lib/gems/2.3.0/gems/rest-client-2.0.2/lib/restclient/abstract_response.rb:223:in `exception_with_response'
	from /var/lib/gems/2.3.0/gems/rest-client-2.0.2/lib/restclient/abstract_response.rb:103:in `return!'
	from /var/lib/gems/2.3.0/gems/rest-client-2.0.2/lib/restclient/request.rb:809:in `process_result'
	from /var/lib/gems/2.3.0/gems/rest-client-2.0.2/lib/restclient/request.rb:725:in `block in transmit'
	from /usr/lib/ruby/2.3.0/net/http.rb:853:in `start'
	from /var/lib/gems/2.3.0/gems/rest-client-2.0.2/lib/restclient/request.rb:715:in `transmit'
	from /var/lib/gems/2.3.0/gems/rest-client-2.0.2/lib/restclient/request.rb:145:in `execute'
	from /var/lib/gems/2.3.0/gems/rest-client-2.0.2/lib/restclient/request.rb:52:in `execute'
	from /var/lib/gems/2.3.0/gems/rest-client-2.0.2/lib/restclient.rb:71:in `post'
	from (irb):10
	from /usr/bin/irb:11:in `<main>'
Wrong Property Value Response
Request details
http :7890/block/at/public height:=243 yields a successful result.
Let’s just issue that command and look at the request headers. Here are the details of the request sent by
httpie:
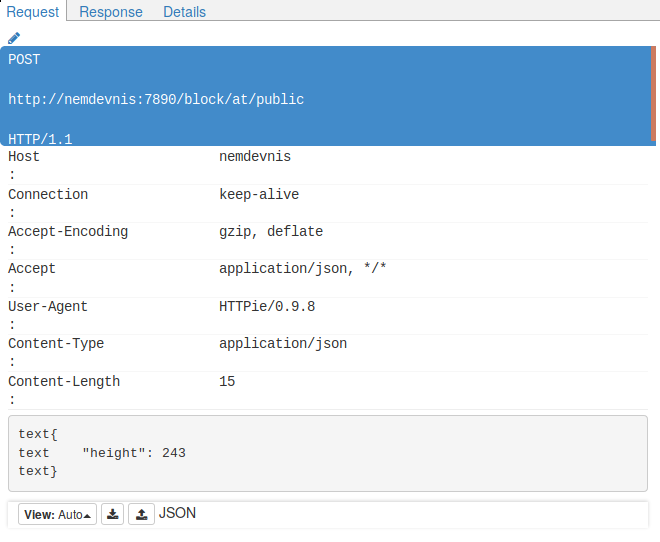
Successful request with httpie
{
    "height": 243
}
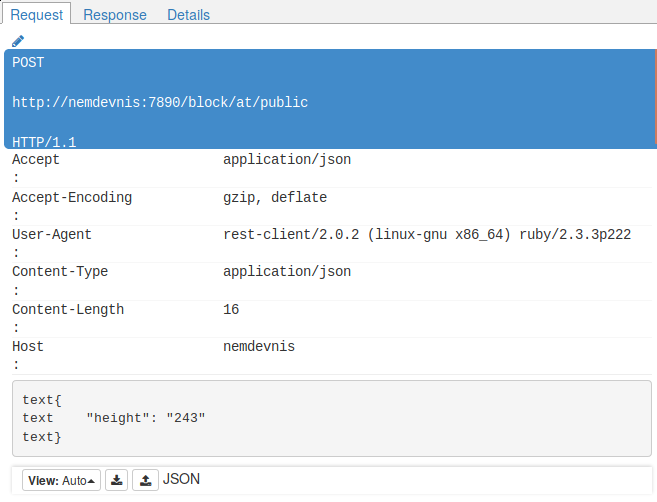
while with rest-client we sent:
{
    "height": "243"
}
We send the value of the height property as a string, whereas it should be an integer.
Let’s see if this fixes our problem:
require 'rest-client'
require 'json'
resp=RestClient.post 'http://localhost:7890/block/at/public', {'height': 243}.to_json, {content_type: :json, accept: :json}
=> <RestClient::Response 200 "{\"timeStamp...">
Sure enough! We now successfully debugged and sent a request from Ruby.
With Postman
Postman is a desktop application letting you setup and send out http requests, helping you debug or explore eg REST APIs.
After starting Postman, you get a window with a text field to enter a URL and a send button:
Postman Start Window
It defaults to sending a GET request. Let’s try it out with the request to get the current chain height.
As a reminder (see blockchain requests), this is a GET request sent to /chain_height.
Entering the URL 62.75.171.41:7890/chain/height and clicking Send results in this state:
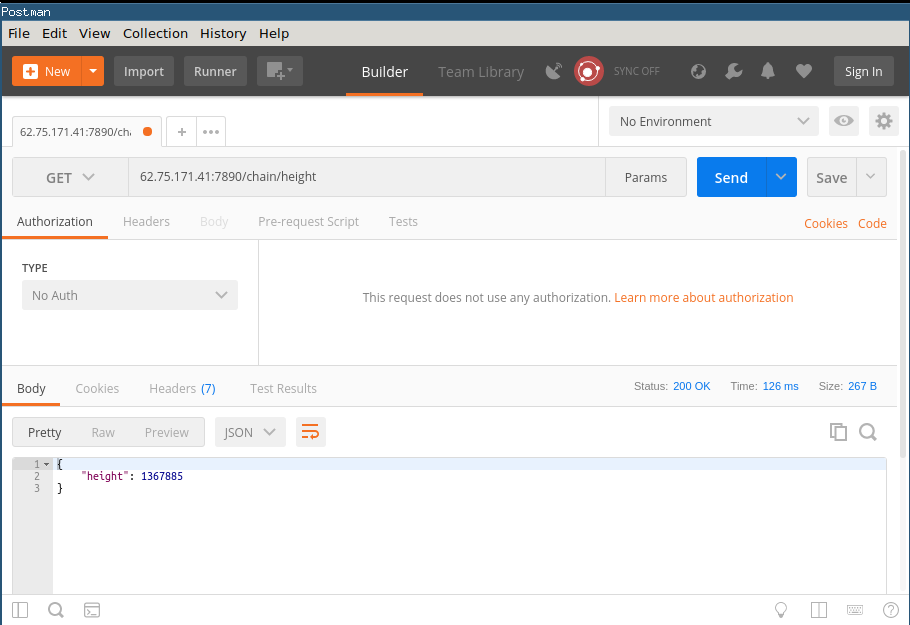
Postman Get Request
But Postman really shines when you want to test a POST request, such as we did in the previous section, to get the block at a certain height. We need to send out a POST request to /block/at/public, with the height requested sent as json in the request’s body.
Creating a new tab, we can enter the needed info in Postman:
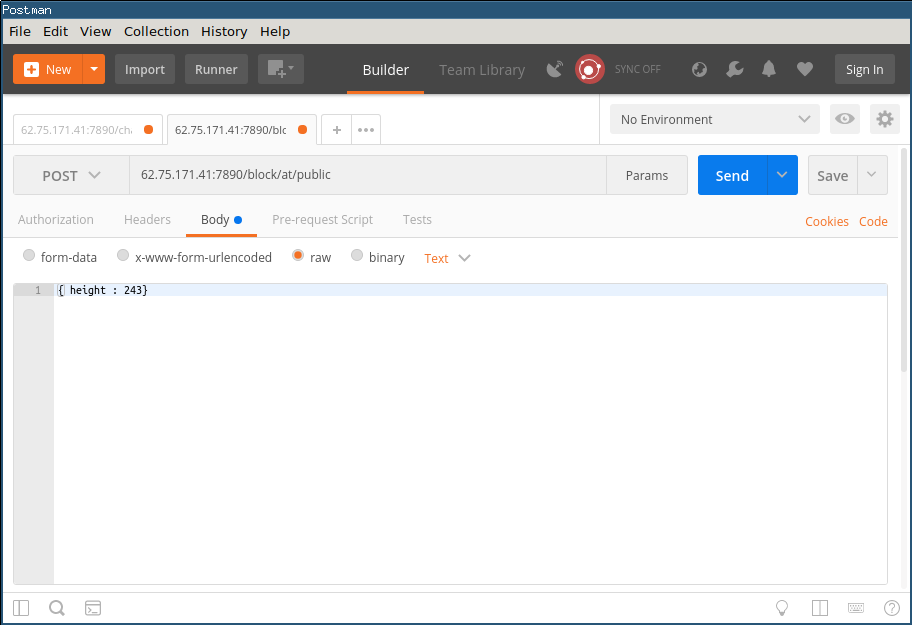
Postman Post Request
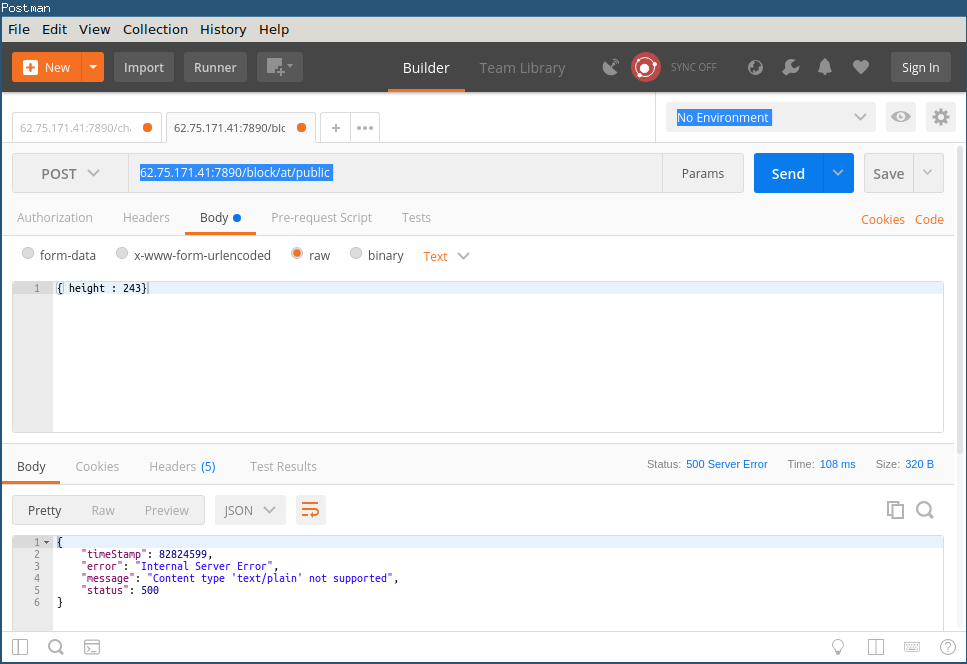
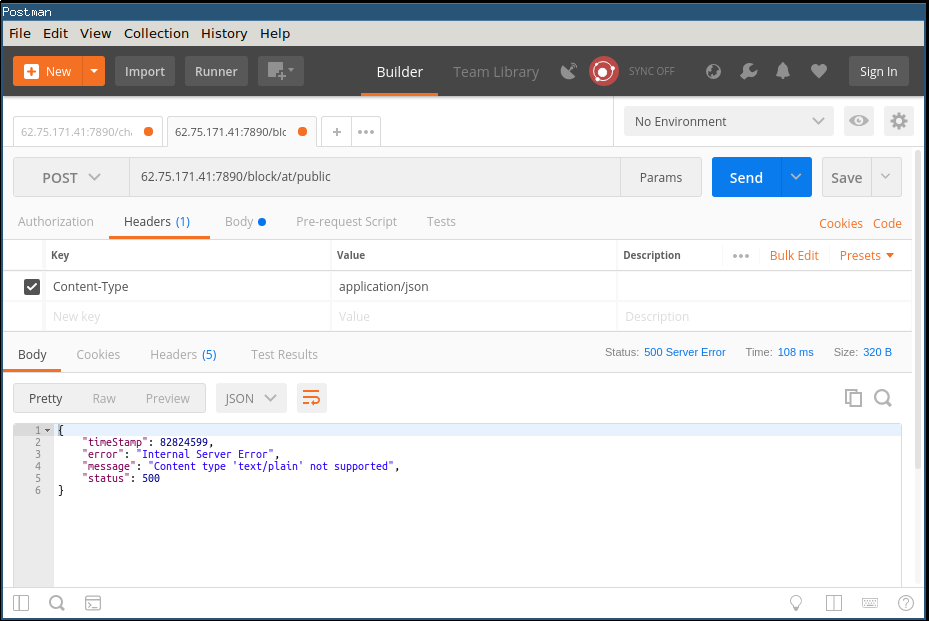
Clicking send results in an error message in the response, stating text/plain content type not being supported:
Postman Post Request Error
We can however specify a application.json content type to be set. This is specified in the HTTP header Content-Type,
hence we open the Headers tab, and add the said header. There is autocomplete available for the key and the value, so
just typing content in the key field will list all headers Postman knows that contain content. For the value, you can just type
json and you’ll get the application/json suggestion. Here’s the status before pressing send:
Postman Post Request Content-Type
With these adjustments, we press send and get the successful answer:
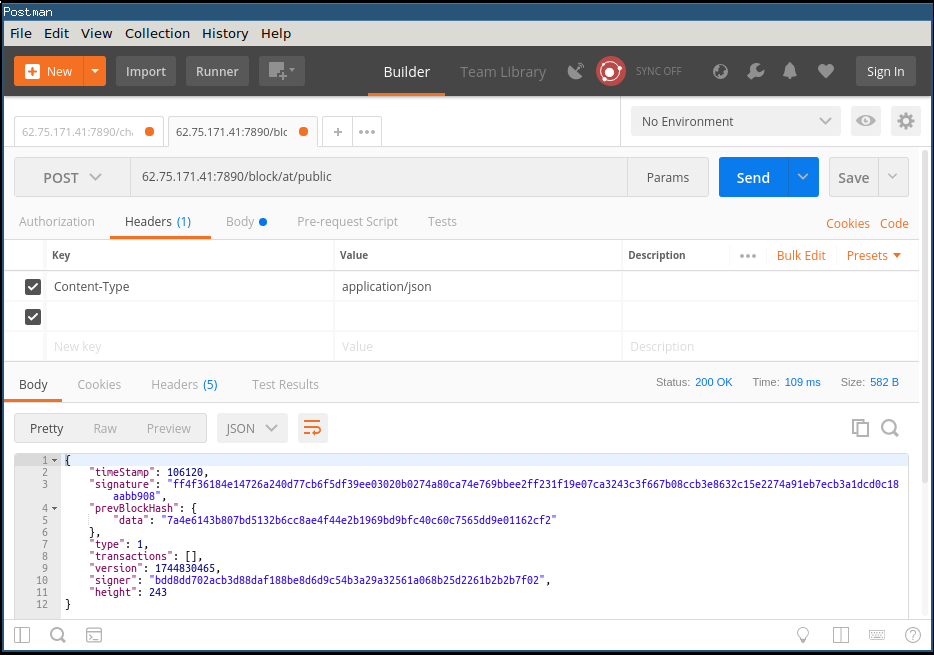
Postman Post Request Content-Type
This is a valuable tool that can help you explore the API, tweaking parameters of a request until it works, and then incorporating what you leant in your application.
Debugging Websockets
Debugging websockets is not as accessible as debugging your HTTP requests. There’s no perfect solution, and we will debug websocket connections with the Google Chrome console, as well as with Wireshark. None of these is great to debug websockets, but combining both tools might help you get forward.
In this section, we will not open websocket connections ourselves, but we will see how to observe the traffic on the websocket connections opened by the NanoWallet.
With Google Chrome
You can open the Google Chrome inspctor by pressing CTRL-SHIFT-I. In the Inspector, select the Network tab (surrounded in screenshot), and select to only
display websockets by clicking on WS (indicated by the red arrow in the screenshot).
If you open the inpector on a page that is loaded, you will have to reload the page as indicated:
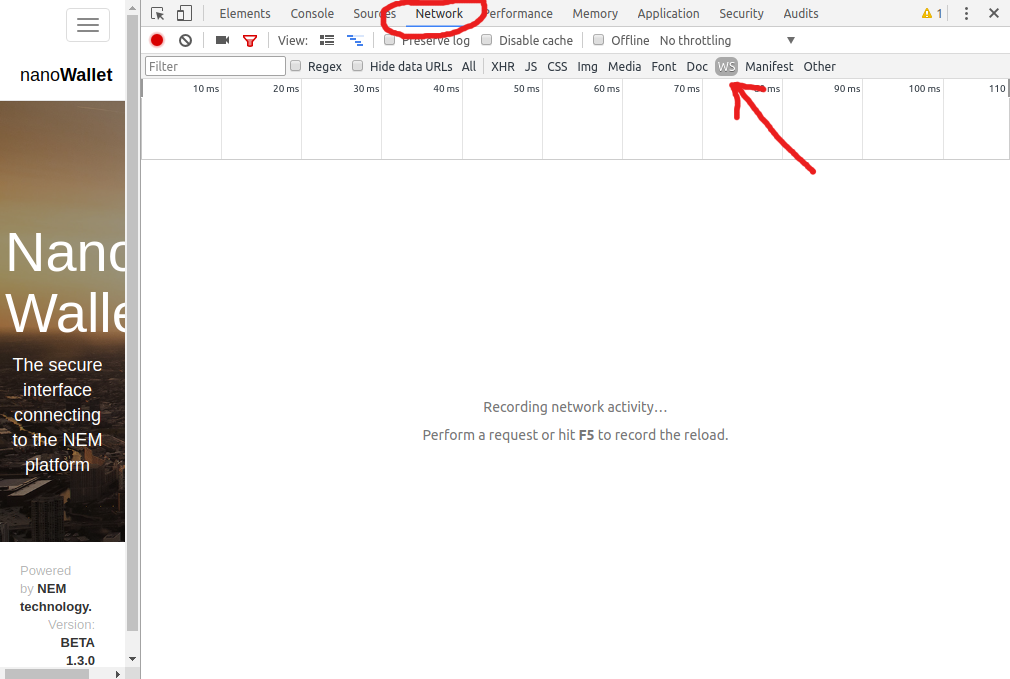
Chrome Inspector Overview
When you login to the NanoWallet with the Inspector open and with the filter displaying only websocket connections, you will see a websocket connection established:
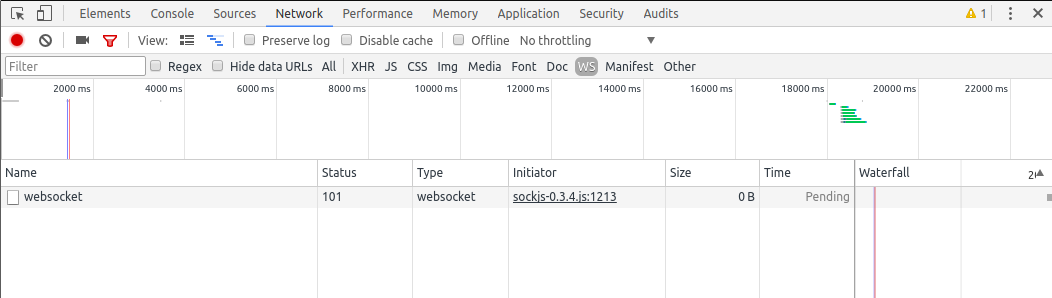
Websocket Connection opened
By selecting the connection in the list, you can take a closer look to the connection. By default, the detailed view of the connection open on the headers tab showing all headers of the connection, both for request and response:
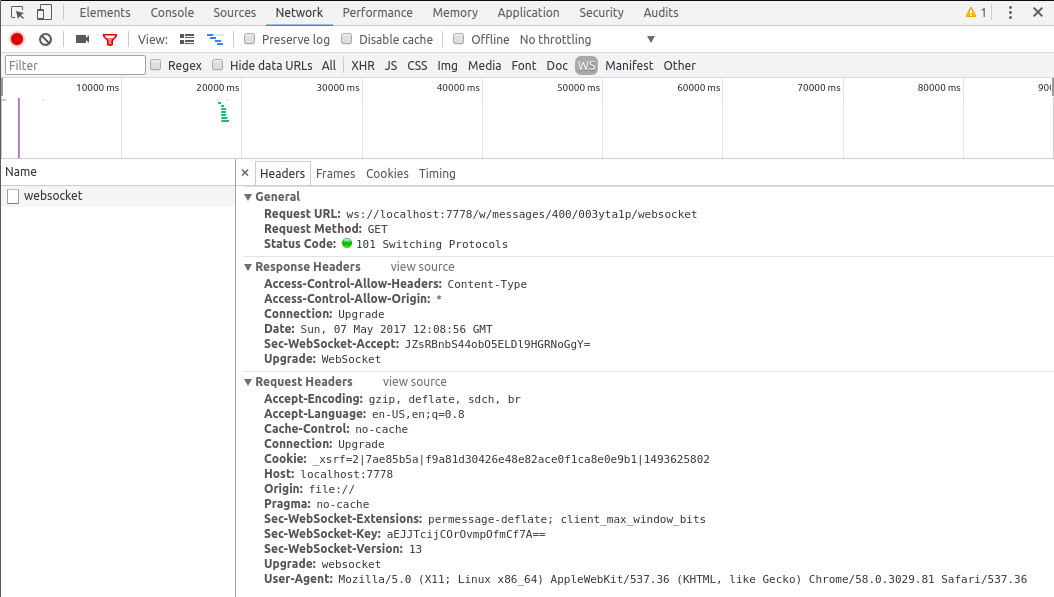
Websocket Connection Headers
The websocket connection is a persistent connection over which multiple data frames are exchanged. Luckily, the inspector lets us take a close look at the frames exchanged. Selecting the Frames tab gives you a list of frames exchanged over the connection. This list is updated automatically as new frames are exchanged:
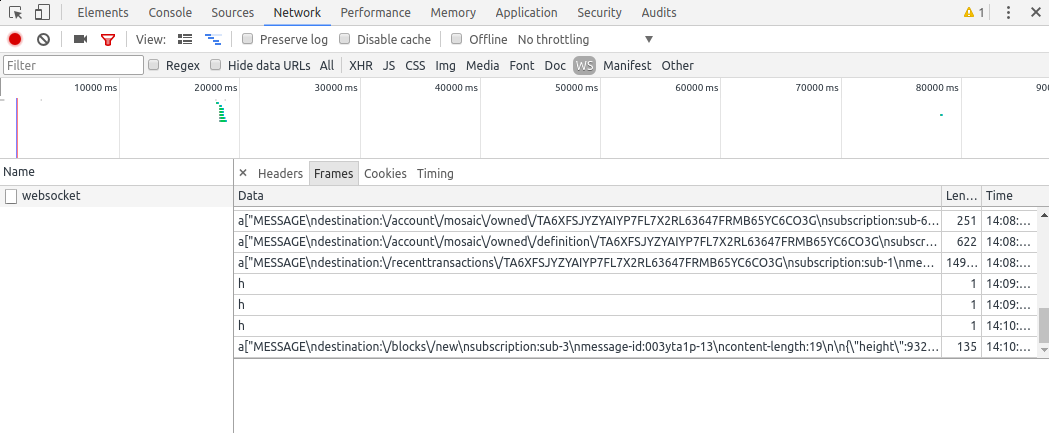
Websocket Connection Frames
Let’s focus a bit on the frames list after opening a wallet in the NanoWallet client:
Websocket Connection Frames List
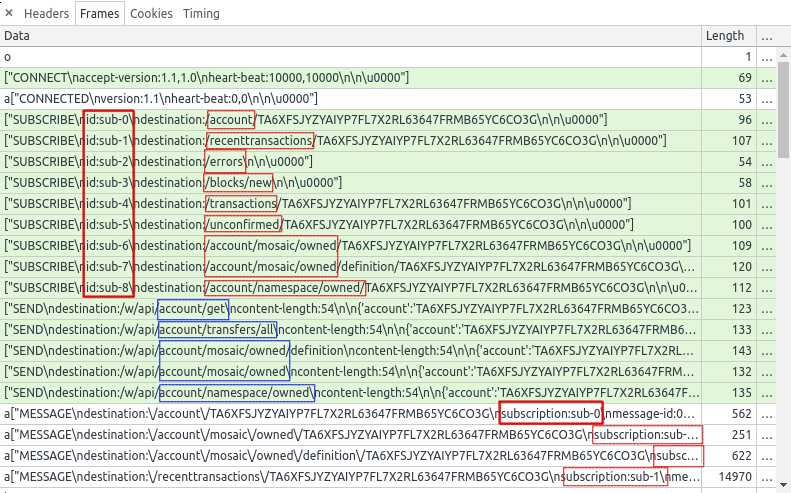
Outgoing messages have a light-green background, incoming messages have a white background. WebSocket opcodes are light-yellow and errors are light-red (from the Google Chrome documentation).
We see that we send a frame to connected, and we get confirmation that we have successfully connected.
After that, the NanoWallet client subscribes to multiple notifications. We see a total of 9 subscriptions
(sub-0 to sub-9) for information regarding the account TA6XFSJYZYAIYP7FL7X2RL63647FRMB65YC6CO3G like
transactions, mosaics, namespaces. There are also global subscriptions for errors and new blocks. Subscription
related information have been highlighted in red in the screenshot.
In addition to subscriptions, some other frames are sent to request information about the account. Subscriptions will only get messages sent when an update is available, but the NanoWallet client needs to retrieve that information to display the current status of the account. This is done by sending SEND command messages. The information regarding these requests are highlighted in blue in the screenshot. We see that the information requested covers the account details, the transactions of that account, as well as the mosaics and namespaces.
Following that are some frames received in relation with the 9 subscriptions just created. The first MESSAGE
received is part of sub-0
Selecting a frame in that list will display its content:
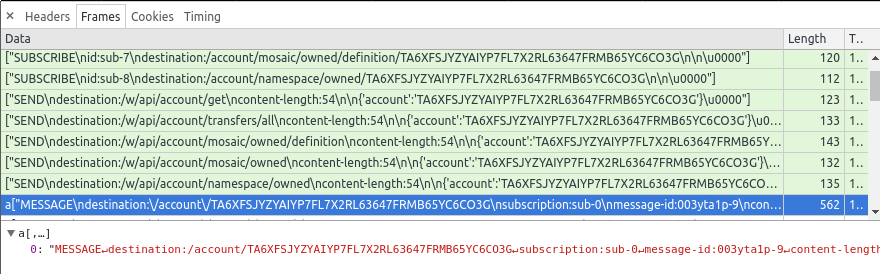
Websocket Frame Details
But here is the result is far from great. The frame’s content is just displayed on one line, which does not ease reading and analysing the frame….
Advanced socket information can be gathered from the Google Chrome internal socket details available at chrome://net-internals/#sockets, but this is out of scope for this guide.
With Wireshark
The container nis container provided with this guide automatically collects traces of the network traffic to and from
the NIS instance it runs. The traces are stored in the traces subdirectory of the directory you configured as the location
for the persistent data. See the variable persistent_location in the file settings.sh in the same location as the ndev
executable used to control the containers.
Two traces are captured: nis.pcap for traffic on port 7890 (http requests) and ws.pcap for traffic on port 7778 (websockets).
We will use the ws.pcap file to observe websocket traffic.
A great tool to analyse the traces captured is Wireshark, and this is what we will use. It is free software, available for Linux, Mac and Windows.
When you start Wireshark, you will not start a live capture but open the existing capture file available in the persistent
location you configured. But as that file is continuously updated, you will git this error:
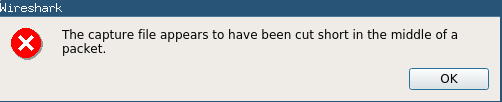
Wireshark Warning
This is not a problem for our analysis, it just means that we have openen a file in which the last packet was not completely written to disk. All packets in the trace are usable though, and will give us a detailed view on the websocket traffic.
When you open the traces file, you get something like this:
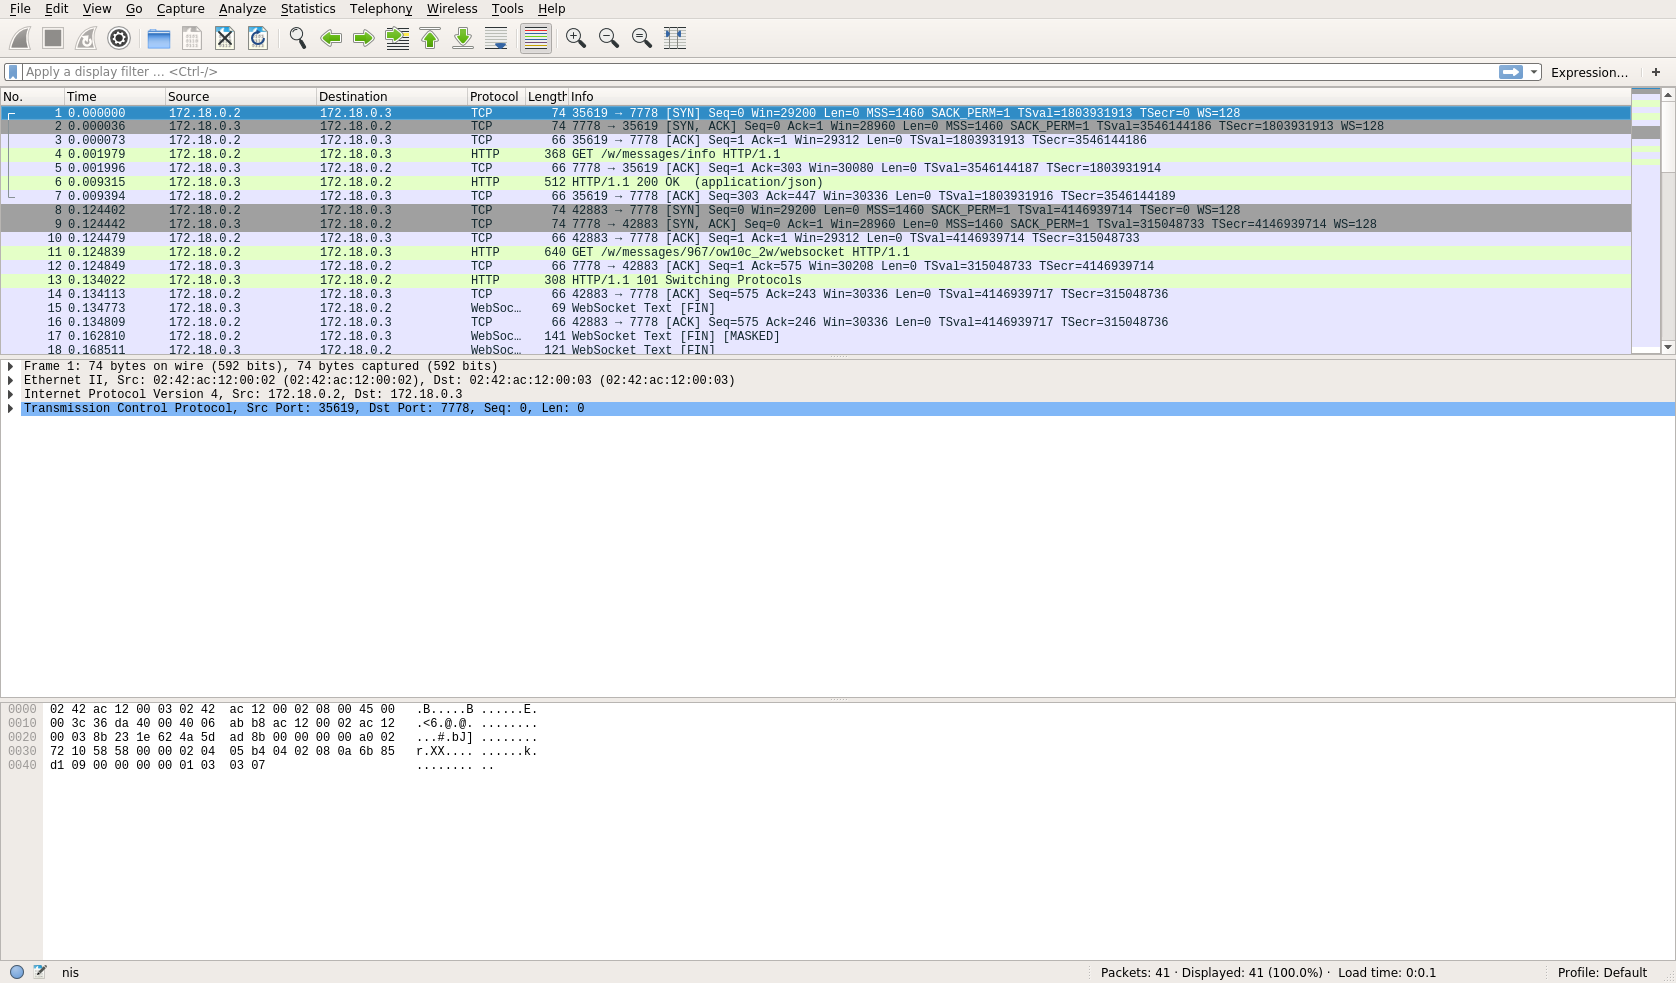
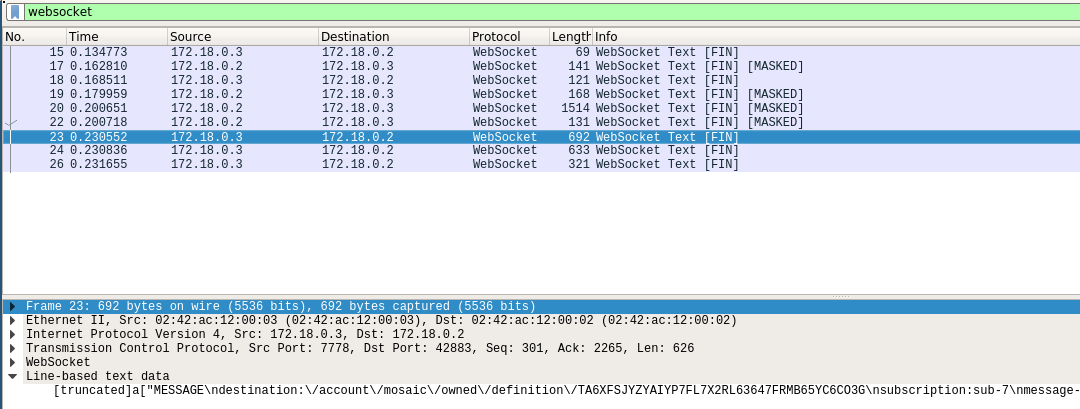
Wireshark window
websocket in the
text field at the top of the list and press enter:
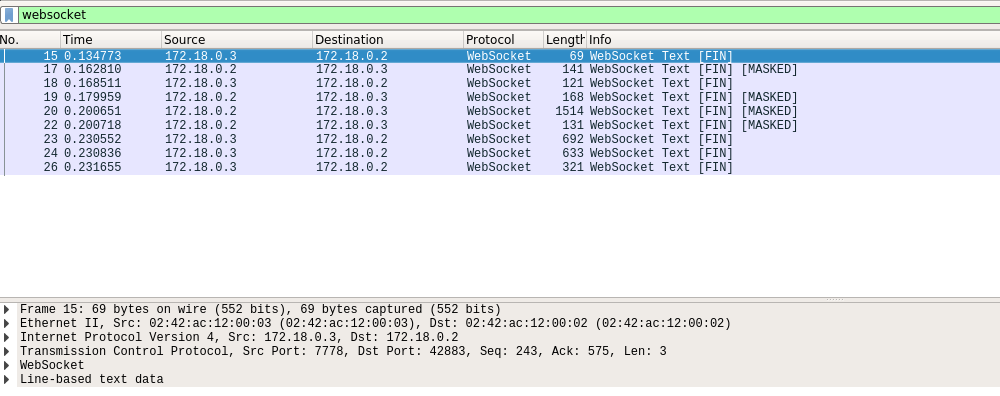
Wireshark filter
As in our analysis with Google Chrome, we see the CONNECT packet sent by our browser:
Websocket CONNECT
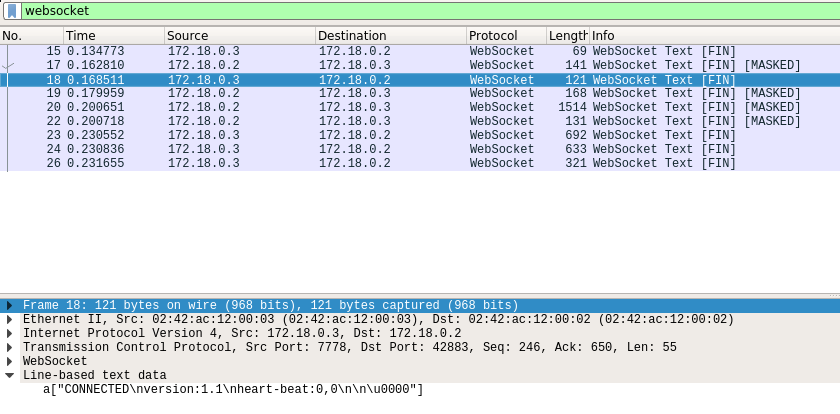
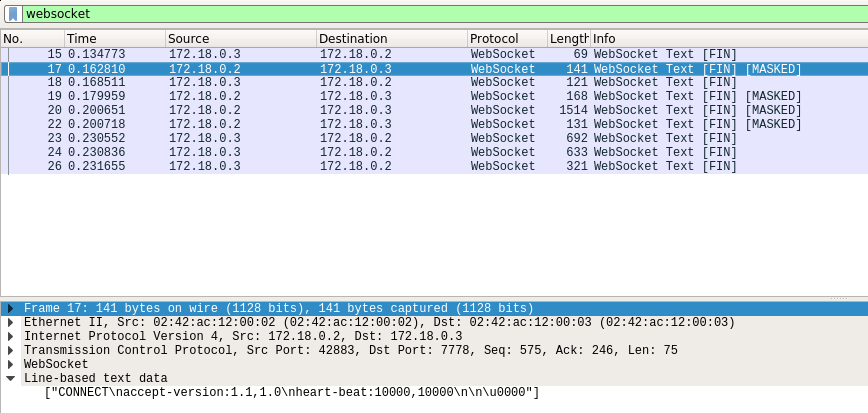
Websocket CONNECTED
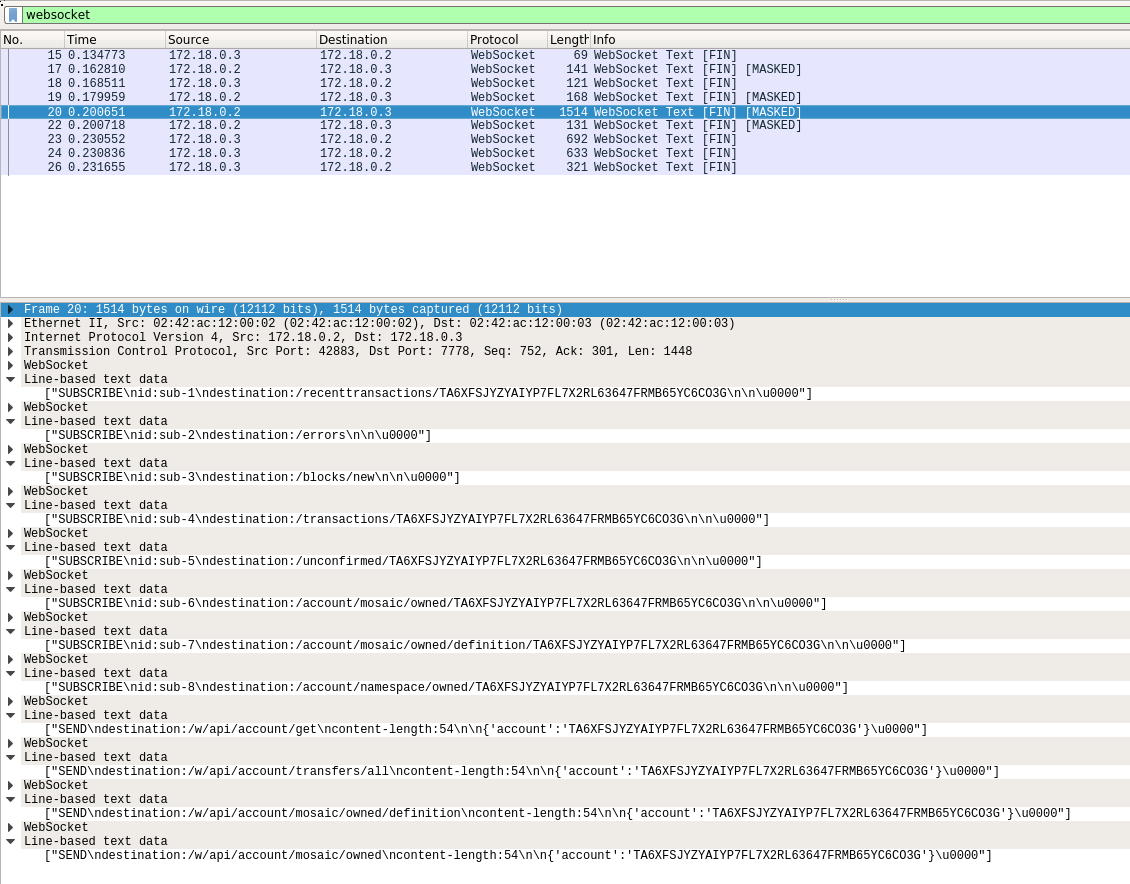
We also see the subscription request being sent:
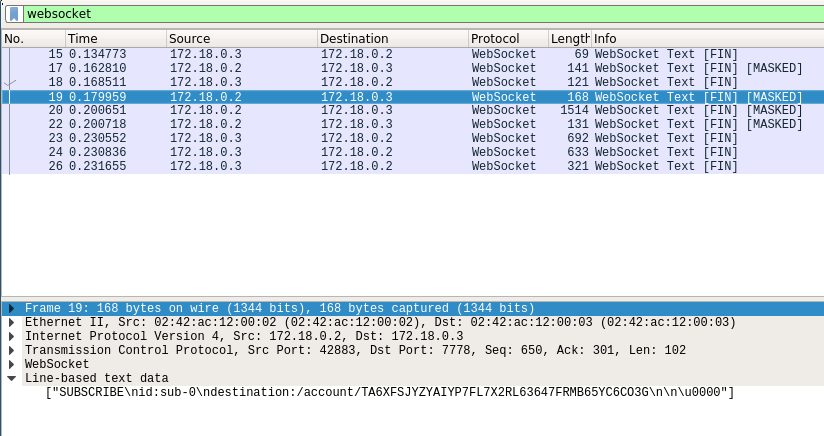
Websocket Connection Frames List
The first request is displayed individually, but the other subscription requests are grouped in one entry:
Websocket Connection Frames List
After that are the SEND command sent by the client:
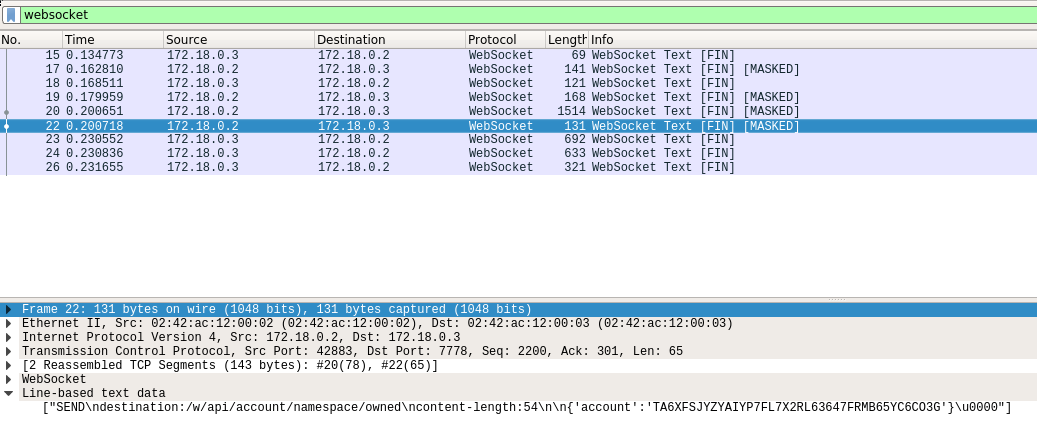
Websocket SEND commands
Websocket MESSAGE answers
But here again, the display is not perfect, but this description should help you get up to speed regarding the debugging of your websocket requests.